This article was originally published in PHP Architect Magazine in the January 2015 issue. I wrote a column called "Leveling Up" from January 2015 until June 2017. The content of the articles here are as they were originally published.
January 2015Leveling Up: Using a Debugger
by David Stockton
In our first Leveling Up column, we’re going to talk about something that should be a go-to tool in every developer’s toolbox: Debugging. We’re going to talk about how to move beyond var_dump, print_r and console.log to use xdebug to help you quickly gain insight into what your code is doing and how to make it work like it should. Debugging is an extremely powerful way to work with your code that most PHP developers don’t take advantage of more.
Introduction
Welcome to the first column of our new series, “Leveling Up”. Each month we’ll explore topics related to how to up your game, advance your career and become a better developer. This month we’re talking about debugging, specifically debugging using Derick Rethan’s Xdebug PHP extension. If you’re running Zend Server, it’s likely you already have Zend Debugger available and most of what we’ll talk about in here will work for you. There are a few differences in options and setup, but the concepts are the same.
Debugging your code using an actual debugging extension and a debugging client* can speed up your workflow by an order of magnitude compared to debugging using var_dump, print_r, or logging methods. Using a debugger allows you to set up “breakpoints” in your code which are spots that your code will pause while running to allow you view the call stack, inspect (and/or change) the values of variables, run methods and functions, etc. You can then step through your code, line-by-line, and see what happens at every step. Just recently, I used a debugger to solve an issue that was happening in our testing environment that I could not reproduce in development.
In my particular case, my code was sending a text message could included a bit of additional information about a user’s status. Under normal circumstances, a user will likely have just one status (in which case it would be included), but could potentially have zero to two or three at the most. In those cases, the status information would not be included in the text message. In our testing environment, the message was never being queued to be sent, but was being sent every single time in development. I attached a debugger to the QA environment and was able to determine that the bit of code that would fetch the status had a problem: namely, I was expecting the query to return just one row of data (the status), but I was seeing it return over 71,000 records. Needless to say, there’s a large difference between retrieving one or two records and hydrating one or two objects and retrieving and hydrating over 71,000 records! In just a few minutes I was able to find I was the missing condition on one of my joins, which was causing a cartesian join to occur. It didn’t happen in development because I had a lot less data. Using the debugger saved, most likely, days worth of effort and frustration.
Getting Started
To get started with Xdebug, you’re going to need to install it. Instructions vary quite a lot from platform to platform, but Xdebug is available for Windows, Mac OSX and Linux. Your install process could be download and put a .dll in place, brew install, yum install, apt get, or whatever your platform uses for a package manager. If that’s not available, there’s also pecl install if you can build and install from source. For windows, download a copy here: http://xdebug.org/download.php. Installation instructions for everything can be found here: http://xdebug.org/docs/install.
Once Xdebug is installed, you’ll need to refer to it in your php.ini or, again, depending on your platform, one of the many .ini files loaded by php. If you installed using a package manager, this part should already be done. It will have added a line similar to the following:
; Enable xdebug extension module
zend_extension=/usr/lib64/php/modules/xdebug.so
Please note, the line above may differ for you depending on OS, where your extensions are installed, etc.
There are a few more settings we’ll need to put in place for this to start working. We’ll step through them one at a time.
xdebug.remote_enable = 1
This line allows Xdebug to connect to your debugging client (typically your IDE). What will happen is that when Xdebug is told to start a debugging session, Xdebug on your server (web server) will initiate a connection from itself to your IDE. By default, this will be on port 9000. If your server cannot connect to the IP of your IDE, you will not be able to do remote debugging.
In order for Xdebug to know what to connect to though, you must tell it. There are two settings that can be used for this:
xdebug.remote_connect_back = 1
or
xdebug.remote_host = 192.168.33.1
For the first, remote_connect_back will tell Xdebug to connect back to whatever IP is connected to the server. This can be very convenient, but it means that anyone who can access your server can potentially debug into it, so unless you’re sure only authorized users can access the server, you might want to use the latter.
For the xdebug.remote_host setting, you’ll want to provide the IP of the computer you’re running your IDE on from the perspective of the web server. In my case, I was running my web server in a VM with an IP of 192.168.33.103. It sees my host computer (where I run PHP Storm) as 192.168.33.1.
You’ll probably also want to set the idekey:
xdebug.idekey = PHPSTORM
For the rest of it, the defaults should be fine, but a list of all the settings are available here: http://xdebug.org/docs/all_settings
To make sure it’s all working, run php -v from the command line. Your output should include a line about Xdebug similar to the following:
PHP 5.5.8 (cli) (built: Jan 17 2014 13:05:38)
Copyright (c) 1997-2013 The PHP Group
Zend Engine v2.5.0, Copyright (c) 1998-2013 Zend Technologies
    with Xdebug v2.2.3, Copyright (c) 2002-2013, by Derick Rethans
The CLI version of PHP will read the ini settings immediately, but your webserver will need to be restarted in order for the changes to work. You should be able to see output similar to the above if you run <?php phpinfo(); in a script you load from your web server.
How Debugging Works
By default, Xdebug works in ‘req’ mode, meaning a debug session will be initiated based on the request of the caller. There is also ‘jit’ mode which will start the debugger automatically when an error occurs. In any case, there’s a sequence of events that happens when a debugging session starts.
- A PHP request is started with a request to debug.
- Xdebug initiates a connection as a client back to the server (the IDE) to start a two way connection between Xdebug and your IDE. This allows the IDE to control the running of the PHP code you’re debugging.
In PHP Storm, you must enable debugging. This is a small “phone” icon that is usually red. Clicking it will turn it green.
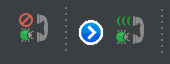
If this icon is not enabled (green) then Xdebug will not be able to connect to the IDE (server).
At this point, your IDE should be ready to accept debugging connections, so we need to start one. First, create a breakpoint in your code. In PHP Storm, you can create a breakpoint by clicking in the margin or gutter next to the line you want Xdebug to stop on. The red circle indicates a breakpoint is on line 6. Xdebug will pause the code right before running line 6. See Figure 2 for what this looks like.
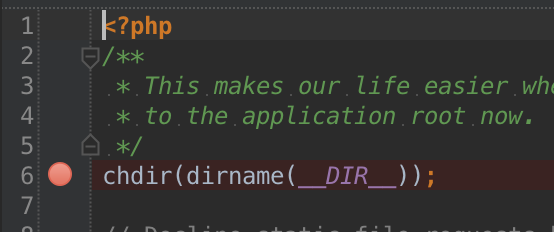
Create a breakpoint on a line of code you’re sure will run. Later on, we’ll be more discerning in setting breakpoints, but for now we want to ensure things are working.
Initiating Debugging From the Web
Debugging from the web is pretty simple. You can add ?XDEBUG_SESSION_START=1 to your query params, you can set a cookie, or you can use one of the xdebug helper plugins for your browser of choice. These allow you to click a button to set the cookie that tells Xdebug to debug.
- For Firefox: https://addons.mozilla.org/en-US/firefox/addon/the-easiest-xdebug/. This extension adds a small green bug icon next to the location bar and a status icon in the lower right corner of Firefox.
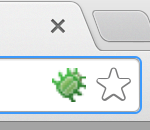
- For Chrome: https://chrome.google.com/webstore/detail/xdebug-helper/eadndfjplgieldjbigjakmdgkmoaaaoc. Like the Firefox extension, this adds a green bug near the location bar that allows you to initiate a debugging session as well as profiling or tracing. We’re not covering profiling or tracing in this article, but this is my preferred extension.
- For Opera: https://addons.opera.com/en/extensions/details/xdebug-launcher/?display=en. Like the others, this adds a bug icon near the location bar to toggle debugging on and off.
- For Safari: https://extensions.apple.com/details/?id=nl.wrep.xdebug-helper.safari-28RC4265JU. This appears to work like the Chrome extension and exposes extra functionality of Xdebug as well as being able to toggle debugging.
Once you’ve toggled on the debug setting or added the query string, make the request. If everything is working, you should see a popup in PHP Storm indicating that there is an incoming request. For best results, make sure the code in your IDE matches the code on the server you’re debugging.
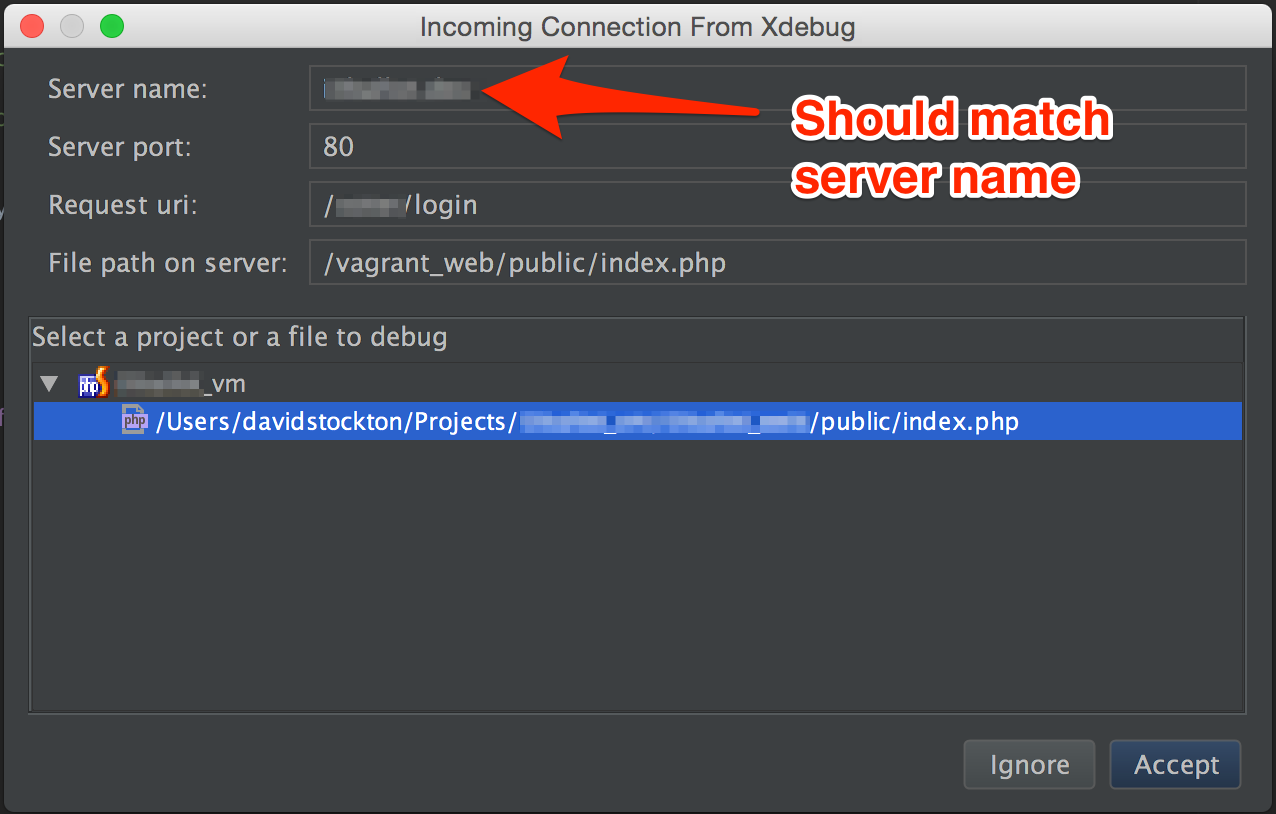
When you accept the dialog shown in Figure 4, PHP Storm will provide a mapping from the file path on the server to the file path of your local machine. If your code follows a standard framework MVC style layout, this mapping will not be sufficient to find the other code, so we need to update the mapping in the settings.
Open PHP Storm’s settings and go to PHP > Servers. In the newest versions of PHP Storm, this is Langauges & Frameworks > PHP > Servers. Use the search function of the settings box if in doubt. You should see the server name that showed up in the connection dialog.
Figure 5 shows what the mapping looks like.
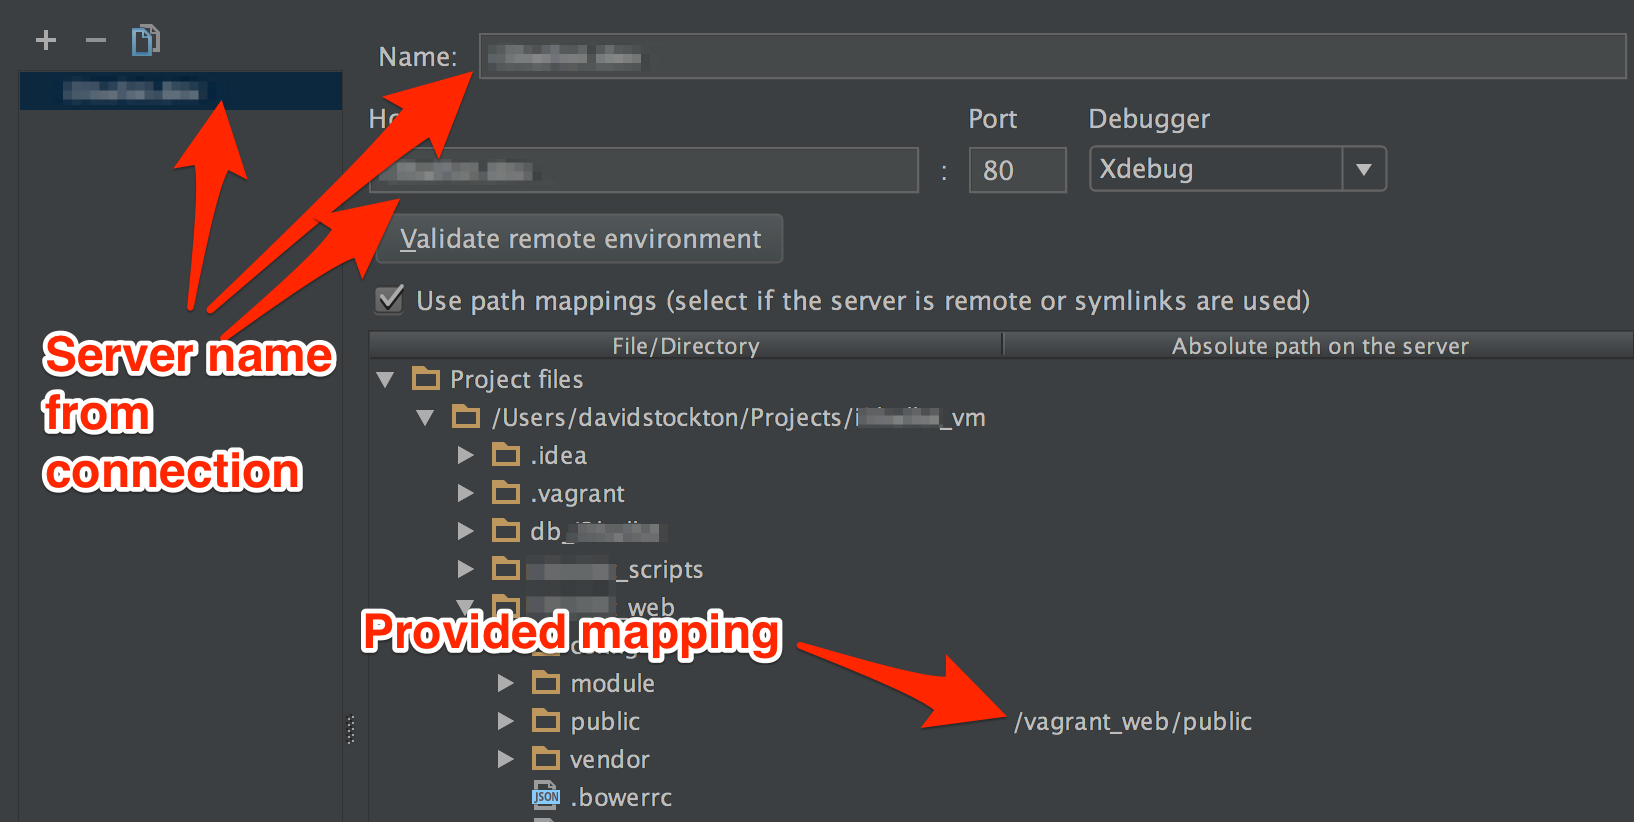
As you can see, the mapping is provided to the index.php file, but we want to be able to debug into any of our project files. To do this, click on the empty area to the right of the root of your project and enter the absolute path on the server to those same files. For me, this is /vagrant_web mapping to my project’s *_web directory. PHP Storm will use the mapping combined with the relative paths of anything below it that hasn’t been specified. This means that you may only need the one mapping, but if your deployment moves things around, the mapping is flexible enough you could specify a path to every single file being in a different place on the server. Not that I’d ever recommend doing that but if you wanted to, you could.
At this point, your code is stopped already and waiting for you. Jump ahead to the running the debugger section to follow along, or if you’re planning on debugging a CLI script, follow along in the next section.
Initiating Debugging from CLI
To start debugging from the command line, you need to set a few environment variables before starting the debugger. Fortunately this is pretty simple.
export PHP_IDE_CONFIG="serverName=yoursevername.com"
export XDEBUG_CONFIG="idekey=PHPSTORM"
If you’ve set your breakpoint from before, you can run your script and you should see the same sort of connection dialog as Figure 4. The setup above will work best if you’re using the xdebug.remote_host=
unset PHP_IDE_CONFIG
unset XDEBUG_CONFIG
My recommendation to simplify the process of starting and stopping the debugger is to make some shell aliases and functions. Listing 1 shows what I use.
function mybugon() {
  export PHP_IDE_CONFIG="serverName=myserver.dev"
  export XDEBUG_CONFIG="idekey=PHPSTORM"
}

function mybugoff() {
  unset PHP_IDE_CONFIG
  unset XDEBUG_CONFIG
}

alias bugon="mybugon"
alias bugoff="mybugoff"
Now let’s learn how to control the debugger.
Running the Debugger
Whether you’ve started the debugger through a web or API call or through a CLI program, the debugger acts the same. Let’s take a quick tour of the debugging interface.
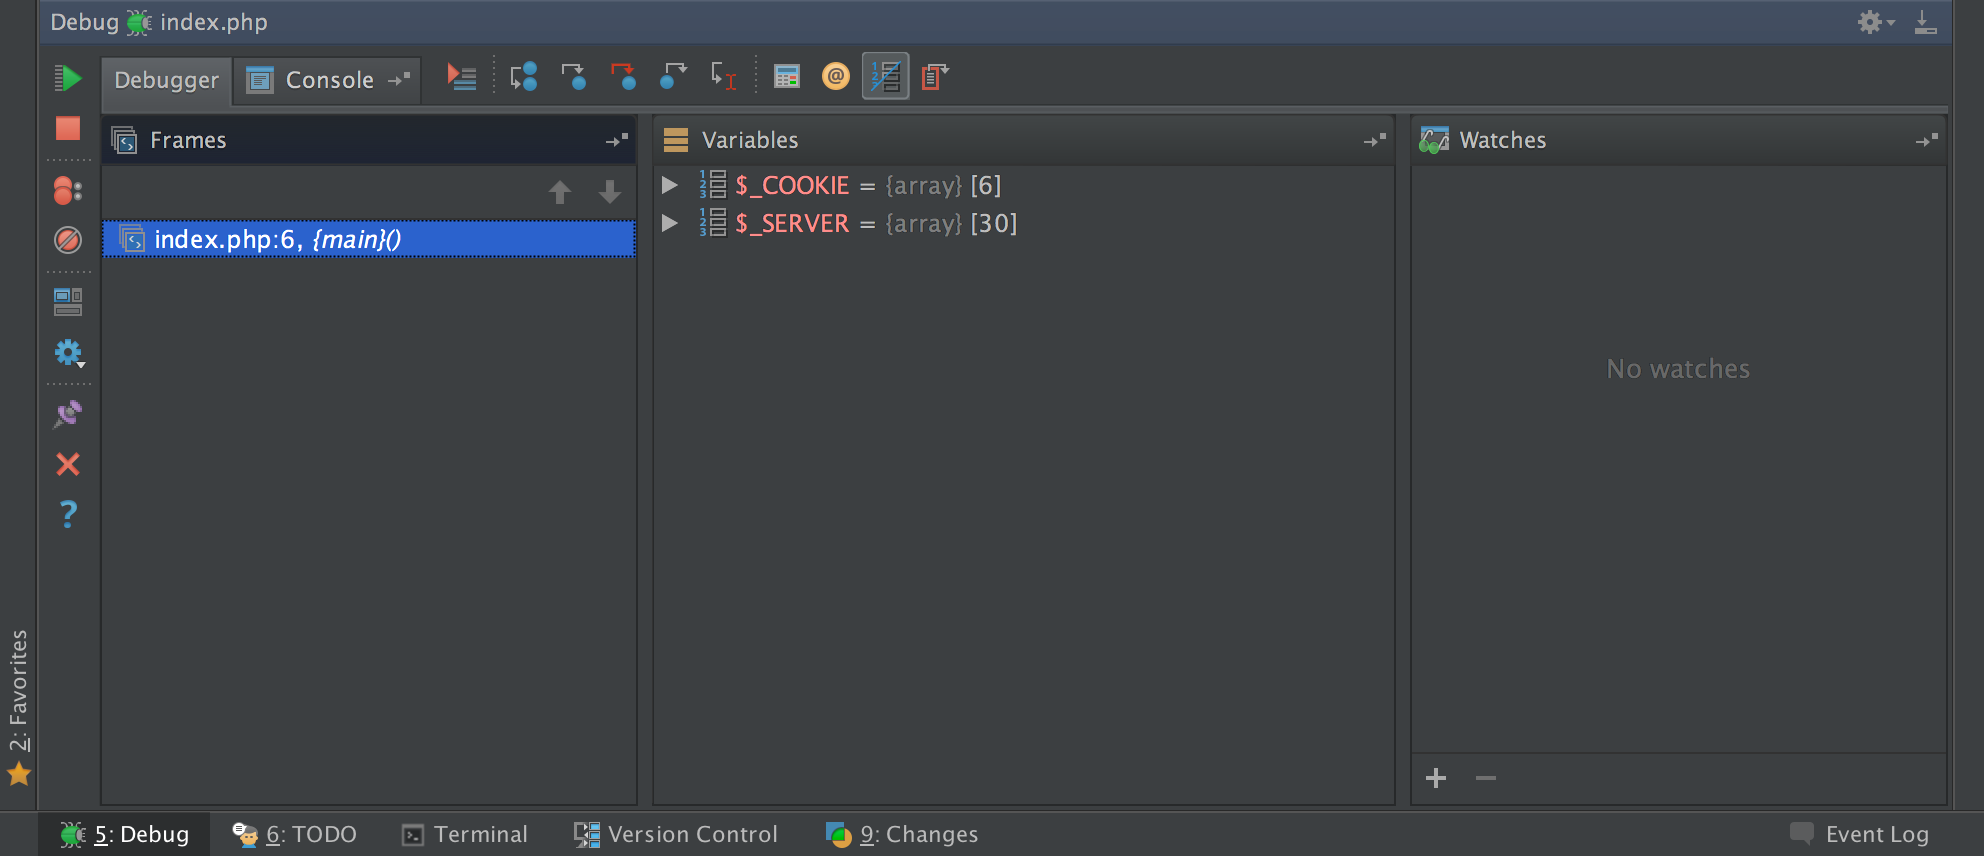
You should see two tabs, one labeled debugger, the other Console. The Console tab will show output from your script. Errors can appear there too, but most of your time will probably be in the Debugger tab. Going from left to right, you should see the Frames panel, the variables panel, and the watch panel.
The Frames panel shows your stack trace. That is the path from one bit of code to the next as your code runs through a series of function and method calls. The top line will be where the code is currently paused. If there are function calls that happen in the course of running your code, this stack will grow. When your code returns from a function or method, the list will shrink. In figure 6, it shows the code is currently paused at line 6 of index.php. The {main}() part shows that we haven’t made any function calls yet.
The next panel is the Variables panel. This panel will show common super globals (like $_SERVER and $_COOKIE as well as $_GET and $_POST) as well as variables that are currently in scope. This means when your code is running in a function, you’ll see variables that have been defined or passed into it. If you’re in a class, you’ll see $this as well as any variables created or passed into the method you’re running.
The final panel is watch. In this panel you can set up variables that you want to show all the time. This could be individual parts of array variables, or even the results of function or method calls. Please be aware that if you add watches to methods or functions with side effects, it will run them and you could end up with your code in a bad state.
Let’s look at the icons in the debugger interface.
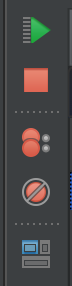
In Figure 7, going from top to bottom:
- The icon that looks like a green “play” button is the resume button. It will tell the debugger to continue running until it hits another breakpoint.
- The red stop icon says to stop the debugger and end the script execution. This is very useful for when you know the script is going to fail or write something incorrect to a database and you want to stop it before it does that.
- The icon with two red circles lists all your breakpoints. You can disable, remove or configure your breakpoints in this screen.
- The red icon that is crossed out disables all your breakpoints. If you want the script to continue without halting but don’t want to remove your breakpoints, toggling this will temporarily turn off the breakpoints and then you can resume the script. You can configure the debugger to automatically re-enable them after the script run is complete, if you want, but it is not the default. I’ve often run into issues thinking the debugger wasn’t working when I had all breakpoints disabled, so be sure to check and make sure you’ve got at least one breakpoint in code that is executed.
- The window icon can reset the debugger to the default layout, in case you’ve accidentally closed out a tab or panel.
There are more icons below, but these are the most important for our purpose. You can discover the use of the others if you need them in the future.
Now for the icons along the top bar.
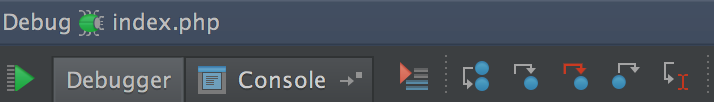
In Figure 8, you’ll see the most important icons in debugging. I’ve left the tabs in for context. The green play button is the same as we discussed earlier. Starting with the first icon after the Console tab:
- The icon with the red arrow and the lines will show the execution point. This jumps your cursor (and view) in the code back to the line where execution is currently stopped. This is nice when you are jumping to other bits of code to research or to predict what will happen next, and then want to go back to see where execution is paused.
- The icon with a blue circle pointing to another is the “Step Over” button. It is one of the most commonly used functions in the debugger. It tells the debugger to execute the current line and go on to the next. If the current line contains a method or function call, it will execute all the code in those calls and return control to the next executable line. Use this when you want the function to run but don’t need to inspect anything inside of it. It is normally mapped to F8 (learning the keyboard shortcuts will help speed up your debugging workflow).
- The icon with the single white arrow pointing to a blue circle is “Step Into” button. It is mapped to F7. This is the function to use when you want to step into a function. You’ll see the Frames (call stack) increase and your cursor will move into the first line of the executed function.
- The icon with the red arrow pointing into the blue circle is “Force Step Into” or Smart Step Into button. If you have a line with multiple function calls, you can use Step Into to run each of them in the order they would be executed. You may only care about one of them though, and Force Step Into allows you to choose which method to step into and will run the others as though you had stepped over them.
- The icon with the arrow coming out of the blue circle is the “Step out” button. When you’re done looking at a function or method, it will run until the function completes and halt at the line after the one that called it.
- The final icon in the top line is “Run to Cursor”. Think of this as a one-shot, temporary breakpoint. It’s useful if you want to stay in a function but may need to get past a large loop. It will run code until it gets to the line where you put your cursor.
There are more icons and functionality in the debugger, but I feel those are the main and most useful bits for your purpose of debugging.
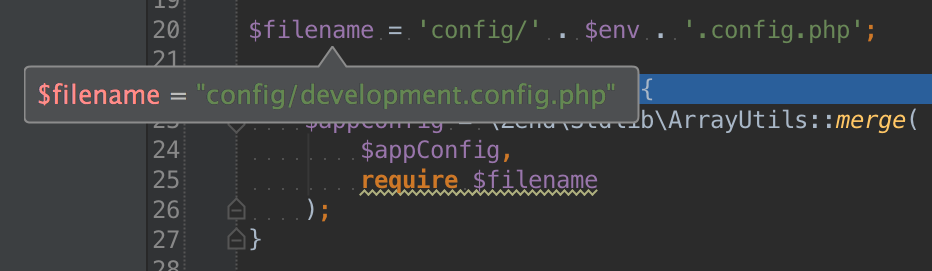
As you progress through your code, you’ll be able to see the value of variables in the variable window (and change them if needed). Hover over the variables in the code window to see their contents. If there’s an error occurring and you’re not sure what’s causing it, it is not uncommon to run past the function that causes the error. You can set a new breakpoint at that function and on your next run, jump right to that point and step through that function. In this way, you can quickly locate the problem.
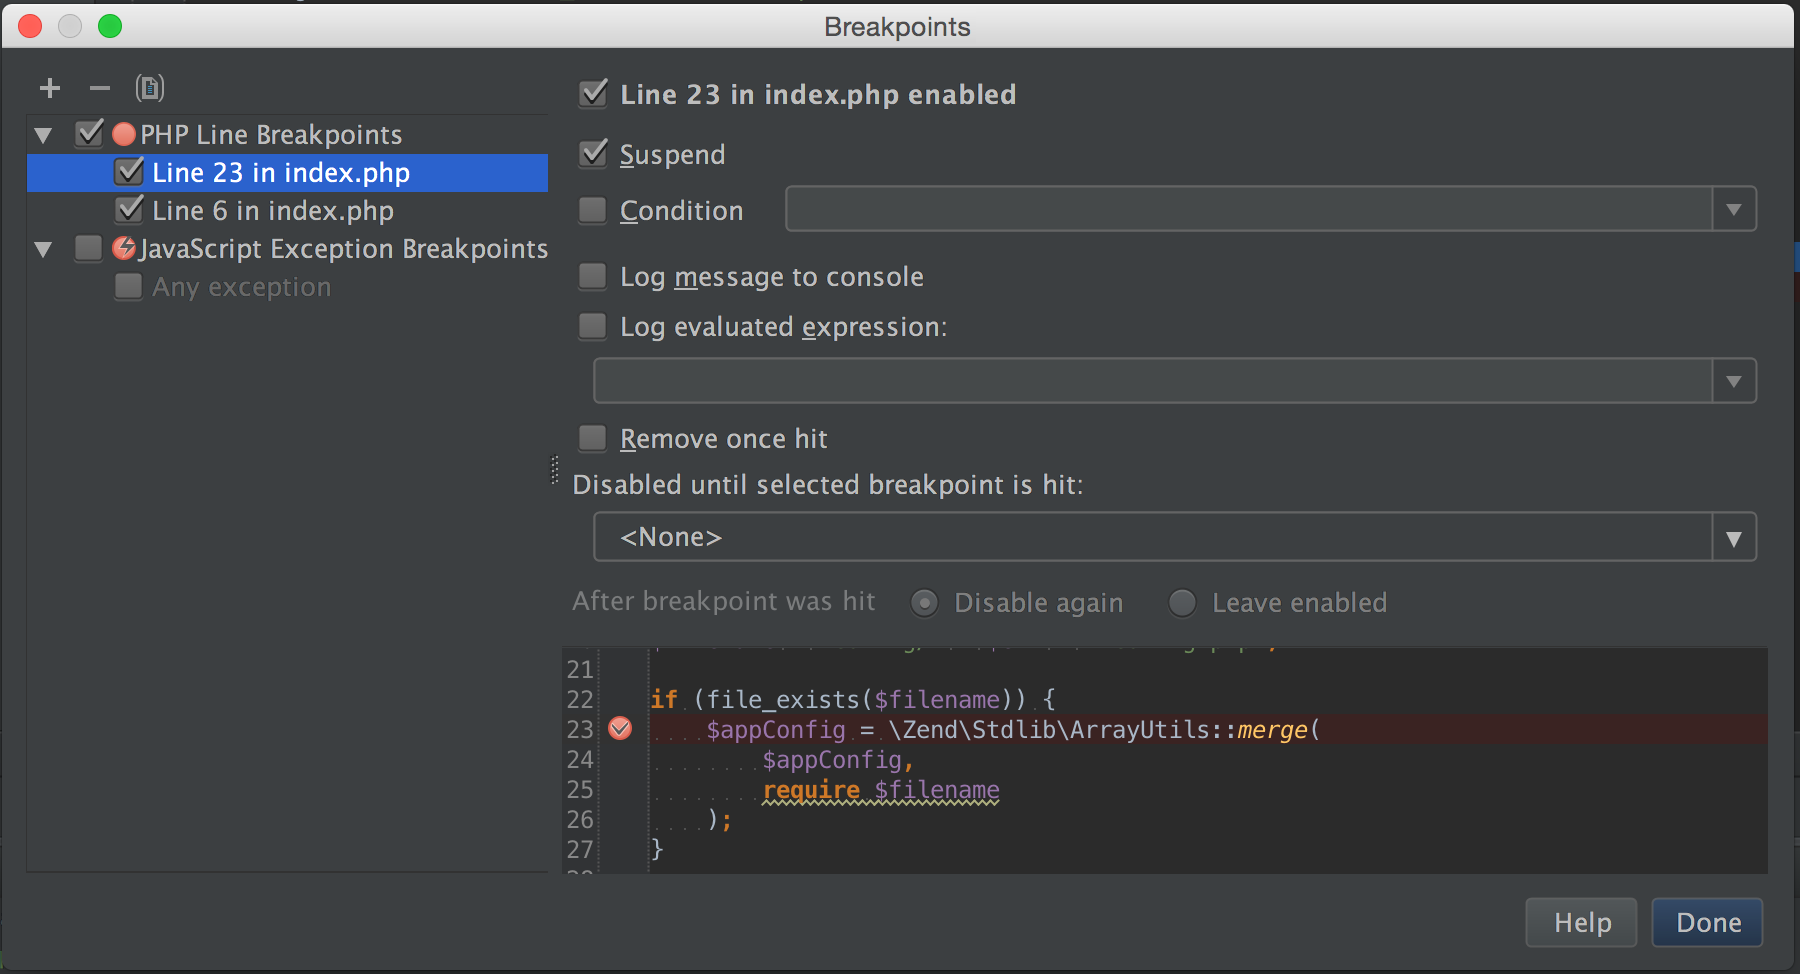
Other functionality worth noting is the ability to configure breakpoints. You can do this through the breakpoint list icon or by right clicking on a breakpoint. You can use this to make breakpoints that only stop when a condition is true. Imagine a situation where you’re looping over 20,000 items and you want to see what happens between the 9,999th and 10,000th. You can create a breakpoint that stops when your counter is at 9,999. In that way, you won’t have to run the loop manually the first 9,998 times. You can also configure breakpoints to be inactive until another breakpoint has been hit, or to log a message to the console instead of stopping execution. All of these tools work to help make you more efficient and become a better developer overall.
Conclusion
In this article, we talked about how to get your debugger set up and ready to run. Learning to use the debugger is one of the most valuable skills you can have as a coder. It can greatly increase your speed and effectiveness in finding and getting to the root of a problem. It can help you more rapidly understand what your code is doing. Practice working with the debugger and it will quickly become your go-to tool when you want to figure out problems and eliminate bugs in your code.
tags: php - debugging - xdebug - phpstorm - php architectBiography
David Stockton is a husband, father and Software Developer. He is VP of Technology at i3logix in Colorado leading a few teams of software developers building a very diverse array of applications. He has two daughters, 10 and 9, who are learning to code in a variety of languages and build circuits and a 3 year old son who has been seen studying calculus and recursive algorithms. David is an active proponent of TDDs, APIs and elegant PHP.